A View from the Tower – 3rd Quarter 2024

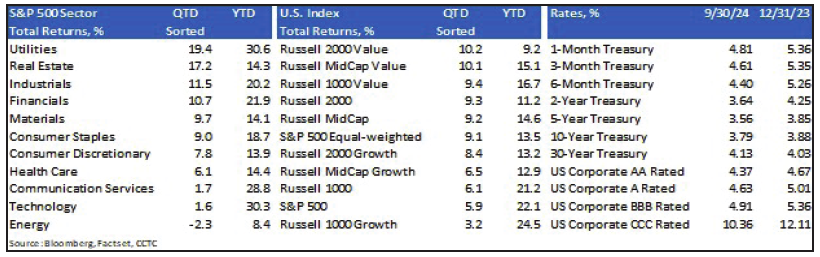
Despite periods of volatility, the third quarter of 2024 finished strong across most asset classes. Domestic equity markets fared well, as the S&P 500 rose 5.9%. Interestingly, utilities led the way. Interest rate sensitive sectors like utilities and real estate benefited as U.S. interest rates fell during the quarter. The utilities sector received an additional boost from speculation regarding increased electricity needs from companies involved in providing data center services and artificial intelligence (AI). Market breadth, or the percentage of stocks participating in the rally, improved as well. The average stock in the S&P 500 was up by 9.1% during Q3, beating the S&P 500 by 3.2 percentage points. Returns on the average stock are represented by the Equal-Weighted S&P 500, while returns in the S&P 500 are weighted according to the market value of each company’s outstanding shares – large technology companies drive a disproportionate amount of the index return. Emerging markets equities rose 8.7%, thanks to the announcement of fresh stimulus measures in China. Chinese stocks were up 23.5% during the quarter. The Bloomberg commodity index was up only 0.7%, as Brent Crude oil prices fell by 17%. However, silver and gold were up 7% and 13%, respectively. The dollar weakened about 6% as the market priced-in U.S. interest rate cuts.
Monetary Policy Loosening Cycle Has Likely Begun
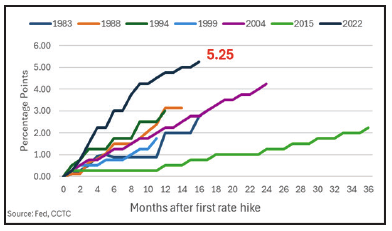 One of the more significant financial events of the third quarter was undoubtedly a change in monetary policy by the Federal Reserve (Fed). At the conclusion of their September meeting, voting members of the Federal Open Market Committee (FOMC) voted to lower the targeted range of the Fed Funds rate by 0.5 percentage points. This change in policy came after the most aggressive tightening cycle in decades. To fight a significant inflationary impulse, the Fed raised short-term rates by 5.25 percentage points between March of 2022 and July of 2023. This action by the Fed has inspired us to take a closer look at the determinates of higher inflation post-pandemic, Fed actions and the data that may be driving interest rate decisions given their Congressionally imposed dual mandate.
Federal Reserve Mandate
The Fed has a primary responsibility to oversee the nation’s monetary policy. This policy is guided by a Congressional directive known as the “dual mandate.” The dual mandate guides the Fed’s monetary policy and requires the Fed to: 1) maintain price stability and 2) promote maximum employment.
The Fed must do its best to maintain steady levels of inflation. This involves ensuring that the general level of prices in the economy remain relatively stable over time. Excessive inflation (a sustained increase in prices) can erode the purchasing power of consumers and businesses, while deflation (a sustained decrease in prices) can discourage spending and investment.
To maintain price stability and combat inflation, the Fed may raise interest rates. This makes borrowing more expensive, discourages spending, and tends to slow down economic growth. However, if the economy is struggling with high unemployment or a deflationary environment, the Fed can lower rates to encourage growth and potentially stabilize prices.
Post-pandemic Inflationary Scare
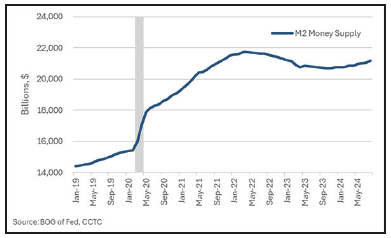 Our latest bout of inflation, presumed by many to have largely been caused by pandemic-era stimulus measures and supply-chain disruptions, can be explained by a variety of conditions in your economics 101 text, first and foremost, the increase in money supply. The abrupt change in M2 (reasonably liquid assets) from March through June of 2020 was largely a result of the $2.2 billion CARES act to provide immediate relief to individuals and businesses affected by the COVID-19 pandemic. Smaller stimulus measures, parts of the CARES act and others, along with robust spending and zero interest rates, continued to drive M2 higher into 2022.
Milton Friedman, renowned for his insights into monetary economics, had a simple explanation for demand-pull inflation: “Too much money chasing too few goods.” We can plainly see the expansion in M2 money supply. M2 rose 41% from February of 2020 until its peak in April 2022. At the same time, we experienced a decline in many goods available for sale because of supply-chain disruptions due to sick workers and lockdowns.
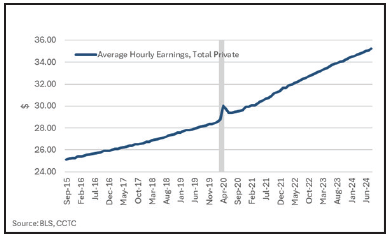 We also experienced something economists would label as cost-push inflation. This happens when the costs of production increase, leading businesses to raise prices to maintain their profit margins. Common causes include rising wages and increased prices for raw materials. We all remember the post-pandemic labor shortages that arose from a variety of factors, such as increased unemployment benefits and other stimulus payments. Parts of the labor market, especially those in service industries, seemed to have little incentive to go back to work. Many businesses had to entice workers with higher wages. Also, as inflation rose, workers began to demand higher compensation. We can clearly see an inflection point in average hourly earnings during the pandemic. In the 54 months prior to the pandemic, hourly earnings rose 14%. During the same period post-pandemic, hourly earnings rose 22%.
The Other Side of the Dual Mandate, the Labor Market
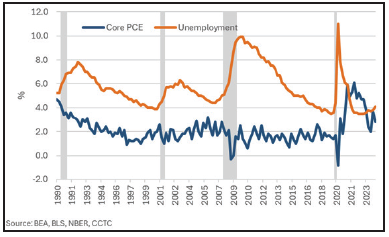 The Fed strives to achieve the highest possible level of employment in the economy, while keeping prices in check. While full employment is ideal, it’s understood that there will always be some degree of unemployment, such as frictional unemployment (due to job search) or structural unemployment (due to skill mismatches). As mentioned previously, to promote maximum employment, the Fed can embark on expansionary monetary policy by lowering interest rates. This makes borrowing cheaper, encourages spending, and may stimulate economic growth. Given the fall in the Fed’s favorite measure of inflation, the Core Personal Consumption Price (PCE) Index, we see a likely path to lower interest rates. The Core PCE index excludes volatile food and energy prices to give the Fed a reading of true long-term inflation risks.
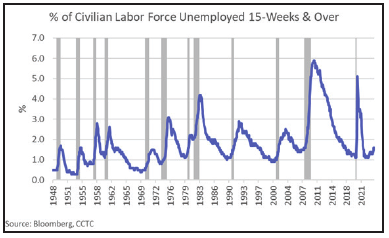
After bottoming in April of 2023 at 3.4%, the unemployment rate has begun to tick higher over the past year. The last reading of 4.1% surprised market forecasters, and we might see more surprises ahead. The percent of the labor force unemployed for 15-weeks and over has been a good leading indicator of the unemployment rate in the past. For sure, the unemployment rate is a lagging indicator of the overall economy’s health. But, in our view, a little bit of slack in the labor force, along with continued moderation of inflation, is what the Fed had been waiting for before cutting interest rates.
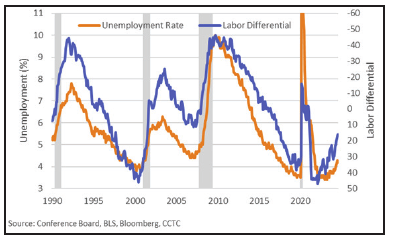 We see additional reason for the Fed to be watching the labor market more consciously given its dual mandate. The Conference Board, a non-profit research organization, publishes the Consumer Confidence Survey once a month. This survey asks individuals questions about their thoughts on the economy, jobs, finances and other economic variables. One of the questions the Conference Boards submits is whether individuals believe jobs are plentiful or difficult to get. The Labor Differential Index (jobs plentiful – jobs difficult to get), has been a good indicator of where the unemployment rate would trend. We think the unemployment rate trends higher, leading the Fed to continue its rate cutting cycle.
R*, the Mysterious Holy Grail of Central Banking
The primary tool the Fed uses to implement monetary policy is the federal funds rate. This is the interest rate at 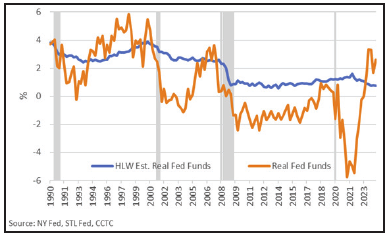 which banks lend reserves to each other overnight. By adjusting the federal funds rate, the Fed can influence the cost of borrowing throughout the economy. However, it is not the nominal rate, the stated interest rate without adjusting for inflation, that the Fed cares about. It is the real Fed Funds rate that is being targeted.
The real interest rate (nominal rate minus inflation) is an important measure because it reflects the true cost of borrowing and the real yield on investments. Savings and investment decisions are made based on real interest rates. Nominal rates do not tell us much about the true cost of money or inflation adjusted investment returns.
R* (pronounced “R-star”) is a key concept in monetary policy. It represents the natural rate of interest, which is the real interest rate expected to prevail when the economy is at full employment and inflation is stable. It is often referred to as the “neutral” rate because it neither accelerates nor slows economic activity. The Fed uses estimates of R* to gauge the appropriate level of interest rates to achieve their dual mandate of maximum employment and stable prices. An important model considered by the Fed is the Holston-Laubach-Williams (HLW) estimate of the neutral rate. In general, if the actual real fed funds rate is above the estimate of R*, we view monetary policy as being restrictive. This continues being the case today, giving the Fed more room to lower interest rates.
Our portfolios are managed with both your risk tolerance and return objective in mind. We genuinely believe that time in the market is key, as attempting to time the market is a fool’s errand. In our view, compounding returns of high-quality portfolios is key towards achieving your financial goals.
All of us at Country Club Trust Company, along with the entire Country Club Bank organization, hope that you and your families are well. Please be assured that we continue to work diligently on your behalf, providing the level of service you have come to expect and deserve. As always, we are ready and willing to be of assistance in any way we can. Should you have any questions, we are always here for you.
Take care.