A View from the Tower – Fourth Quarter, 2023

 Mega-cap Growth Continues to Drive the Bus
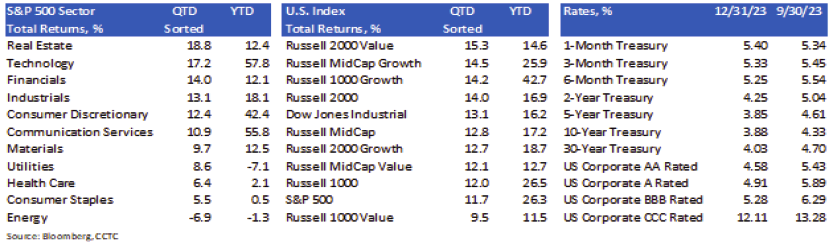
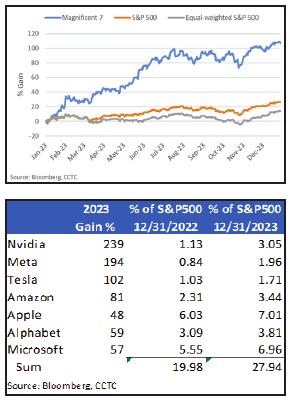
The average large-cap equity, as represented by the equal-weight S&P 500, by and large performed in-line with large-cap growth stocks overall. However, the largest seven names in the S&P 500 index drove most of the gains in 2023. The Magnificent 7 (“Mag 7”), as they are known, accounted for 77% of gains in the index during the year. Several factors played a role, in our opinion. Earnings growth and a flight to quality are top of mind.
First and foremost, 2023 earnings growth for this handful of stocks should be spectacular relative to the average large-cap equity. With 3-quarters in the books, year-over-year 2023 earnings growth expectations for the S&P 500 Index are basically flat. However, when we look at the Mag 7, earnings growth is expected to be up an average of 77%. For 2024, the earnings growth differential is expected to be less substantial, however, the Mag 7 are still prognosticated to post growth more than 2.2X that of the index.
We have to believe that a flight to quality drove interest from market participants as well. Many have been worried about a substantial economic slowdown for well over a year now. In that environment, the equities of companies with strong secular growth characteristics tend to outperform. Most of the names in the Mag 7 are connected in some way to the artificial intelligence boom; Nvidia the most so. Also, this group has large exposure to cloud computing, which is viewed as somewhat protected in the event of a reduction in enterprise computing spending. Interestingly, as the soft landing (no recession) scenario gained traction in the back-half of the fourth quarter, the Mag 7 sputtered a bit, while the average large-cap equity performed well.
Fed and Treasury Calling the Shots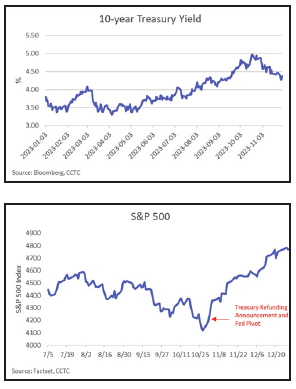
We all know that Federal Reserve policy can substantially affect activity in capital markets. However, it seems the Treasury has been operating counter-cyclical policy as well. On November 1st, they provided both bond and equity markets with the exact news they wanted to hear. Fed Chair Jerome Powell signaled that the rate hiking cycle was over, as the Summary of Economic Projections provided by Fed Governors and Bank Presidents forecast additional reductions in rates relative to past projections and the Treasury announced that it was reversing an August decision that had a substantial impact on liquidity conditions in the economy. We have to wonder what spooked Jerome Powell and Janet Yellen. It could have been as simple as financial conditions had tightened too much, too quickly as both equity and bond markets were in the midst of a multi-month sell-off.
The Treasury Put
Wait, isn’t that supposed to be the Fed put? The belief by financial market participants that the Fed will step in to buoy markets at any sign of distress? No, there is a new player in town. We suppose that’s what happens when you put an Ex-Fed Chair, Janet Yellen, in charge of Treasury. Or could it be that we are in an election year? Anyway, at the beginning of every federal government quarter (November, February, May, August) the Treasury Department issues guidance for the amount and maturity of bills, notes, and bonds it expects to issue over the coming three months. The August and November announcements each had a twist. In August, the Treasury communicated that it anticipated issuing more long-term debt going forward than it had in the recent past. In November, it reversed course and forecast higher amounts of very short-term debt. As reflected in both Treasury yields and the S&P 500 index’s returns, the first surprise worried investors, while the second caused sheer joy. Why does it matter?
First, bond market investors began to worry about how this extra issuance of long-term debt would be absorbed, in other words, was the supply of long-term debt going to overwhelm demand and send yields higher. Accordingly, investors began to demand a higher yield on the debt to account for this risk. As can be seen in the Treasury yield chart, 10-year yields began trending meaningfully higher in August. At the end of July, the 10-year Treasury yielded 3.97%, while closing October at 4.88%.
Equity market investors were affected as well. The S&P 500 lost about 8.5% of its value between August 1 and the end of October. Typically, equities struggle when long-term interest rates are rising. This happens because we discount future earnings at higher rates, lowering the current value of assets.
There was an additional effect of selling more long-term bonds relative to short-term bills, market liquidity. To be sure, higher interest rates impact liquidity. The higher cost of borrowing lowers demand for loans, and therefore the purchase of goods and services. Higher interest rates typically lead to less money floating around in the economy – less money to find its way into markets. But there is another aspect we need to consider. At least in today’s world, the Treasury can choose to have an impact on liquidity, or not, given the maturities of debt it issues.
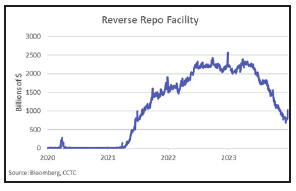 In 2014, the Federal Reserve introduced something called the overnight reverse repurchase (”repo”) facility to improve control of the fed funds rate. Basically, this facility can be used by financial institutions and money market funds to park cash overnight and earn a return similar to the fed funds rate. This facility has been getting much more use by money market funds over the past couple of years due to volatility in the Treasury bill market. However, the slowing/halt of rate hikes by the Fed has lowered volatility in the bills market and bills now yield a consistent premium over what money market funds can achieve at the reverse repo facility. The Janet Yellen Treasury took notice. Money market funds are now exiting the Fed’s reverse repo facility and buying Treasury bills.
Typically, when the Treasury issues debt, short-term liquidity comes out of the real economy. Cash that could be used to purchase goods and services is transferred to the Treasury in exchange for a debt instrument. However, when money market funds are buying bills with funds that were previously used in the reverse repo facility, there is no liquidity event. Funds are not being withdrawn from the real economy. Effectively, the Treasury is drawing down the reverse repo facility and injecting those funds into the economy by paying its bills. This maneuver injected close to $1.5 trillion dollars of liquidity into the economy during 2023.
It Does Not Appear That We Entered a Recession in 2023
There is an old saying on Wall Street, attributed to Mark Twain, that has generally held up as true: “History doesn’t repeat itself, but it often rhymes.” This statement continues to be a guiding force when projecting capital market dynamics into the future. There is typically a period in the past that can provide insight into our current position in the business cycle, and what lies ahead. Following this methodology in the current cycle has led to wildly inaccurate forecasts, to this point at least. Indicators that have been bullet-proof for 75-years or more have failed us. We don’t sense a rhyme.
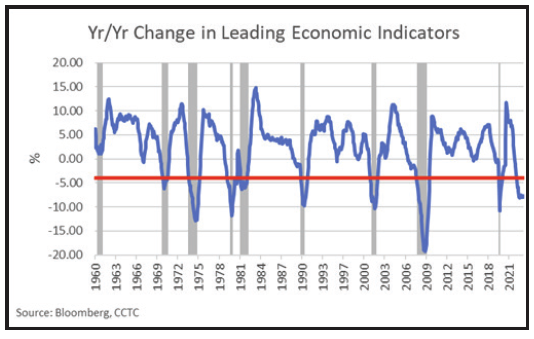 In its December 2022 survey, most of the National Association for Business Economics (NABE) members believed there was greater than a 50% chance of a recession in 2023. And, for good reason. It is currently very difficult to find an indicator that would tell us the economy is on sure footing. About the only thing that comes to mind currently is the recent surge in equity markets. Let’s look at one widely followed indicator, the Conference Board’s Leading Economic Indicators (LEI’s). Not surprisingly, this index looks at ten financial and non-financial variables that tend to lead the economy. When year-over-year growth declines by more than 4%, a recession is typically around the corner. The year-over-year growth rate in the LEI’s has hovered around -8% since Q1, 2023. Can we explain why these forward indicators have failed us for the first time in decades? Maybe.
We first brought this subject up in the Q2, 2023 edition of View from The Tower. In our view, it all goes back to the massive amount of pandemic-related stimulus. At one point in 2021, consumers had amassed $2.2 trillion in savings over what past trend-lines would suggest. The forward-looking indicators Wall Street uses to make projections do not incorporate highly abnormal levels of savings that can be used to offset weakness in economic variables. In addition, we do not have a reliable way to quantify the level that these excess savings have been spent down.
There have been numerous studies, and qualitative evidence is building that mid-to-lower income consumers have exhausted pandemic era savings. However, it does not appear that consumption patterns have changed materially. We thought there were some signs appearing during October, but those quickly abated. Did Fed and Treasury actions have something to do with this? Possibly, or it could be complete coincidence. The holiday spending binge in November and December was unexpected by many market observers. Let’s see if we can keep it up in the new year.
Our portfolios are managed with both your risk tolerance and return objective in mind. We truly believe that time in the market is key, as attempting to time the market is a fool’s errand. In our view, compounding returns of high-quality portfolios is key towards achieving your financial goals.
All of us at Country Club Trust Company, along with the entire Country Club Bank organization, hope that you and your families are well. Please be assured that we continue to work diligently on your behalf, providing the level of service you have come to expect and deserve. As always, we are ready and willing to be of assistance in any way we can. Should you have any questions, we are always here for you.
Take care.